Birthday Paradox
See why 23 people is enough to share a birthday, the theory and a live simulation, side by side.
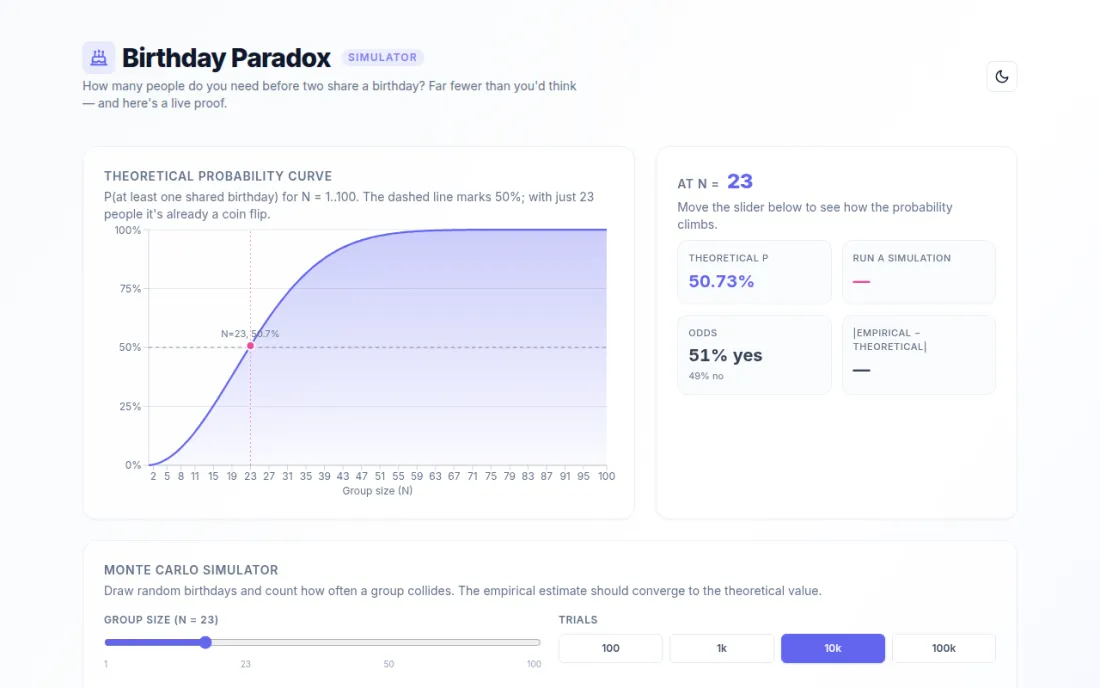
The birthday paradox is the standard example of a true thing that feels wrong: in a room of just 23 people, it's more likely than not that two of them share a birthday. Most people hear the answer, nod, and still don't believe it, because the explanation is a formula, and a formula doesn't move. I wanted something you could push on instead of read.
So this puts the math and the experiment in the same view. On one side is the exact probability curve; on the other is a Monte Carlo simulator that actually deals out random birthdays, trial after trial, and tallies how often a collision shows up. Watch the empirical number climb toward the theoretical one and the result stops being a claim you take on faith and starts being something you just saw happen.
What it shows you
- Plots the exact curve: the theoretical probability P(N) for group sizes from 1 to 100, with the crossover at N = 23 marked where the probability first passes a coin flip, at 50.73%.
- Runs a live simulation: a Monte Carlo engine deals random birthdays for up to 100,000 trials and reports a running empirical estimate next to the theoretical value, so you can see how far off it is at any moment. Each trial fills a 365-slot byte array and stops at the first repeat, since one collision is all a trial is asked for.
- Stays smooth under load: trials are chunked across requestAnimationFrame frames rather than run in one blocking loop. A chunk is a sixtieth of the run, floored at 50 trials and capped at 5,000, so the progress bar animates and the page keeps drawing while 100,000 trials go through.
- Lets you turn the knobs: adjust the group size (1–100, starting at 23) and the trial count (100, 1k, 10k, 100k, starting at 10k) and re-run to feel how each one changes the answer and the noise.
- Shows a single sample as people: one group is drawn as named strangers with birthdays, coloured by which of them collide, from a pool of 161 first names and 149 last names. Sort by collision group, name or date, filter to one group, search for a person, or redraw. The sampler is a seeded mulberry32 PRNG and the seed is printed under the grid, so any group you find can be reproduced exactly.
What it assumes
Both the curve and the simulation treat the year as 365 equally likely days. That ignores February 29 and the seasonal clustering that real birth records show, which is the standard simplification for this problem and is stated in the app rather than left implied. Two notes under the charts carry the reason the answer is surprising: 23 people make C(23,2) = 253 pairs, and P(N) is one minus the probability that all N birthdays are distinct.
Built with
Vite · React 18 · TypeScript (strict) · Tailwind · Recharts. Four colour themes ship with it, Tokyo Night, Miami, Matcha and Gruvbox, remembered between visits. The probability math, the simulator and the seeded sampler all live in one file, src/math.ts. Static bundle on GitHub Pages, so it runs entirely in the browser with no backend.